Iodine Number and CTC in Gold Recovery Carbon: What They Can and Cannot Tell You
How to interpret two common activation indicators—and why direct gold adsorption, particle size, and abrasion data are needed for carbon selection
Author: YICARB Technical Expert (15+ years experience in activated carbon industry)
Introduction
Iodine number and CTC in gold recovery carbon are useful quality indicators, but neither is a direct measurement of gold-cyanide adsorption performance. Iodine number is determined by adsorption from an aqueous iodine solution, while CTC activity measures carbon tetrachloride uptake under a gas-phase test. Both can help describe aspects of pore development or activation quality; however, buyers should combine them with gold-specific adsorption tests, particle-size distribution, and mechanical durability data before judging how a carbon may perform in a CIP, CIL, or CIC circuit.
1. What Iodine Number Can Tell You
ASTM D4607-14(2021) defines iodine number as the milligrams of iodine adsorbed per gram of carbon under the specified aqueous test conditions. The standard describes it as a relative indicator of activated-carbon porosity. It may approximate surface area for some carbon types, but ASTM explicitly warns that the relationship cannot be generalized because it changes with raw material, processing conditions, and pore-volume distribution. Adsorbed volatiles, sulfur, and water-extractable material can also affect the result. [1] For buyers, interpreting iodine number and CTC in gold recovery carbon means using each test for its intended purpose and then verifying gold-specific performance separately.
For a buyer, iodine number is therefore useful for checking batch consistency and comparing products tested by the same method. It can provide a broad indication of activation and pore development, but it cannot establish how rapidly a particular carbon adsorbs gold from a cyanide solution or how much gold it will load in a plant.
2. What CTC Activity Can Tell You
CTC means carbon tetrachloride activity. ASTM D3467-04(2020) defines the result as the percentage ratio of carbon tetrachloride adsorbed by the carbon sample when saturated under the test conditions. ASTM states that this measurement is basically related to pore volume and can be useful for quality control of gas-phase activated carbons. The same standard cautions that the result does not necessarily measure effectiveness for other adsorbates or other operating conditions. [2]
This distinction matters in gold recovery. CTC is a gas-phase test using carbon tetrachloride; gold recovery is an aqueous process involving dissolved gold species and the chemistry of the process solution. A high CTC value should not be interpreted as a guaranteed high gold adsorption rate, higher equilibrium loading, or higher plant recovery.
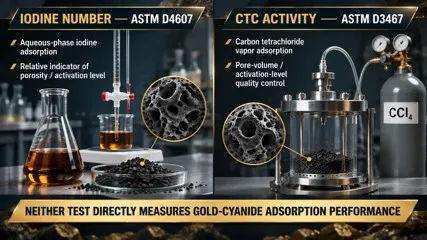
Figure 1: Iodine number and CTC are different activation tests—not direct gold adsorption tests.
3. Compare What Each Indicator Measures
|
Parameter |
Test basis |
Useful for |
Cannot prove |
|
Iodine number |
Iodine adsorption from aqueous solution; reported in mg/g |
Relative porosity / activation comparison under the same test method |
Gold-cyanide adsorption rate or plant gold recovery |
|
CTC activity |
Carbon tetrachloride uptake under gas-phase saturation; reported as % |
Pore-volume / activation-level quality control, especially for gas-phase carbons |
Effectiveness for gold species in aqueous process solution |
|
Gold adsorption test |
Gold-bearing process solution contacted with a defined carbon fraction |
Gold adsorption rate and loading under stated test conditions |
Automatic performance in a different plant without site validation |
4. Why Direct Gold Adsorption Testing Is Essential
A 1986 Society for Mining, Metallurgy & Exploration paper on activated carbon for precious-metals recovery identifies gold adsorption rate and adsorption capacity as independent variables and recommends testing both when selecting carbon. It also reports that historical activity tests were of limited value for selecting carbon specifically for gold recovery. [3]
A direct comparison should use a representative gold-bearing solution and a clearly defined carbon particle-size fraction. Keep the main test conditions consistent:
· Gold concentration and solution source (synthetic gold-cyanide solution or representative plant solution).
· Free cyanide, pH, temperature, ionic strength / dissolved salts, and relevant competing species.
· Carbon dosage, solution-to-carbon ratio, particle-size fraction, and sample preparation.
· Agitation or mixing conditions, vessel geometry, and the contact-time schedule.
· Gold concentration remaining in solution at each time point, plus final gold loading on the carbon where available.
5. Measure Adsorption Rate and Loading Separately
The kinetic curve shows how quickly dissolved gold concentration falls or carbon loading rises with time. It helps answer whether the carbon can adsorb gold within the contact time available in the plant. Equilibrium or near-equilibrium loading describes the amount of gold held after sufficient contact under the selected test conditions. A product may be fast at the beginning but reach a lower final loading; another may load more at equilibrium but approach that loading more slowly.
A historical Gold Fields Operating Co. carbon-testing procedure provides a useful example of a controlled comparison—not a universal standard. It used 2 g of an 8×10 carbon fraction with 995 mL of a 20 ppm Au/Ag cyanide solution, rolling at 40 rpm. Solution samples were taken at 15 minutes and then at 0.5, 0.75, 1, 1.5, 2, 3, 6, 18, and 24 hours; tests were duplicated and a carbon/solution gold mass balance was required. [4]
The important lesson is not to copy those exact settings. It is to report the carbon size, solution composition, carbon dose, agitation, sampling times, analytical method, replicates, and mass-balance check so the result can be interpreted and repeated.
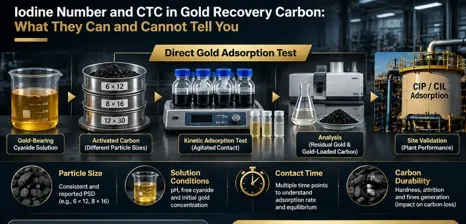
Figure 2: A fair gold-carbon comparison combines controlled adsorption testing with particle and durability checks.
6. Include Particle Size and Abrasion Resistance
Particle size affects adsorption kinetics and carbon retention. ASTM D2862-16(2022) measures granular-carbon particle-size distribution and notes that distribution changes can affect adsorption rate and packed-bed pressure drop. Compare products using the same specified sieve fraction or full PSD—not a nominal mesh label alone. [5]
Mechanical durability is equally important. ASTM D3802-23 ball-pan hardness is useful for comparing lots of the same grade, but ASTM cautions that it does not directly measure in-service degradation. ASTM D5159-04(2020) identifies abrasion as a common cause of dusting and warns that laboratory hardness results do not necessarily predict field experience. [6]
Review hardness and attrition data together with fines generation and particle-size changes after handling or regeneration; confirm the result in a representative plant trial where possible.
7. A Practical Buyer Checklist
|
What to request |
What it helps establish |
|
Iodine number and test method |
Relative porosity / activation indicator and batch consistency |
|
CTC activity and test method |
Gas-phase pore-volume / activation quality-control information |
|
Gold adsorption kinetic curve |
Rate of gold uptake at defined contact times |
|
Equilibrium or final gold loading |
Gold capacity under the stated solution conditions |
|
Sieve analysis / particle-size distribution |
Actual size range, oversize, undersize, and fines |
|
Hardness and attrition results |
Comparative mechanical quality; not a stand-alone prediction of plant wear |
|
Test solution and conditions |
Whether supplier results are comparable and relevant to the buyer's process |
8. Application Example
Illustrative example - not a customer case study: Supplier A reports higher iodine and CTC values, while Supplier B shows faster gold uptake under matched test conditions. The buyer compares final loading, particle-size distribution, hardness/attrition, and fines after handling before arranging a site trial. Higher indirect values alone are not enough to select Supplier A.
YICARB Perspective
YICARB recommends using iodine number and CTC as supporting quality indicators—not substitutes for gold-specific adsorption rate and loading, particle-size distribution, durability, and compatibility with the site's CIP, CIL, or CIC conditions.
Conclusion
Iodine number and CTC in gold recovery carbon describe aspects of porosity and activation quality, but cannot independently predict gold adsorption rate, equilibrium loading, or plant recovery. Use them with direct gold adsorption tests, particle-size and abrasion data, and site validation to select carbon for the actual circuit.
Public Standards and Technical References
[1] ASTM D4607-14(2021), iodine number test method; relative porosity indicator and stated limitations.
[2] ASTM D3467-04(2020), carbon tetrachloride activity test method; pore-volume/activation QC and stated limitations.
[3] Faulkner, Urbanic & Ruckel (1986), “Activated Carbon for Precious Metals Recovery,” SME.
[4] Gold Fields Operating Co. (1992), “Activated Carbon Testing Program,” historical site-specific test procedure.
[5] ASTM D2862-16(2022), granular activated-carbon particle-size distribution.
[6] ASTM D3802-23, ball-pan hardness; ASTM D5159-04(2020), dusting attrition guide.

Products
Solutions
Performance
Markets & Cases
Resources
Manufacturing & Quality
About Us
Contact Us

Copyright © 2026 Guangdong Yicarb Activated Carbon Co., Ltd. All Rights Reserved.